


Dintero Launches Brand New Analytics Dashboard in Backoffice


Dintero is taking a major step forward in providing our merchants with superior insight and control over their sales. We are proud to launch a completely new Dashboard in the Dintero Backoffice, offering deep, detailed analytics on transaction volume, refunds, and performance broken down by payment method.
This new dashboard is engineered to give you more than just numbers—it delivers actionable insights to help you optimize both sales strategies and financial reconciliation.
Visualize Your Sales: From Volume to Detailed Insights
The new main dashboard provides an instant, visual overview of your key data points. At the top, you can track vital volume metrics, including your estimated next payout, uncaught transactions, and total authorized amounts.
The most powerful new analytics features include:
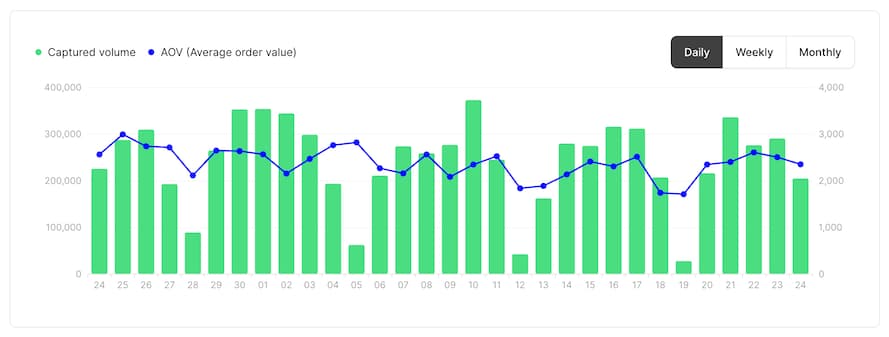
- Detailed Volume Graph: Easily track the evolution of your Captured Volume and AOV (Average Order Value) over time with clear line and bar charts. You can effortlessly filter the view by Day, Week, or Month.
- Instant Status Overview: Get a quick glance at your most important totals: Captured, Refunded, and Total Sales Volume.
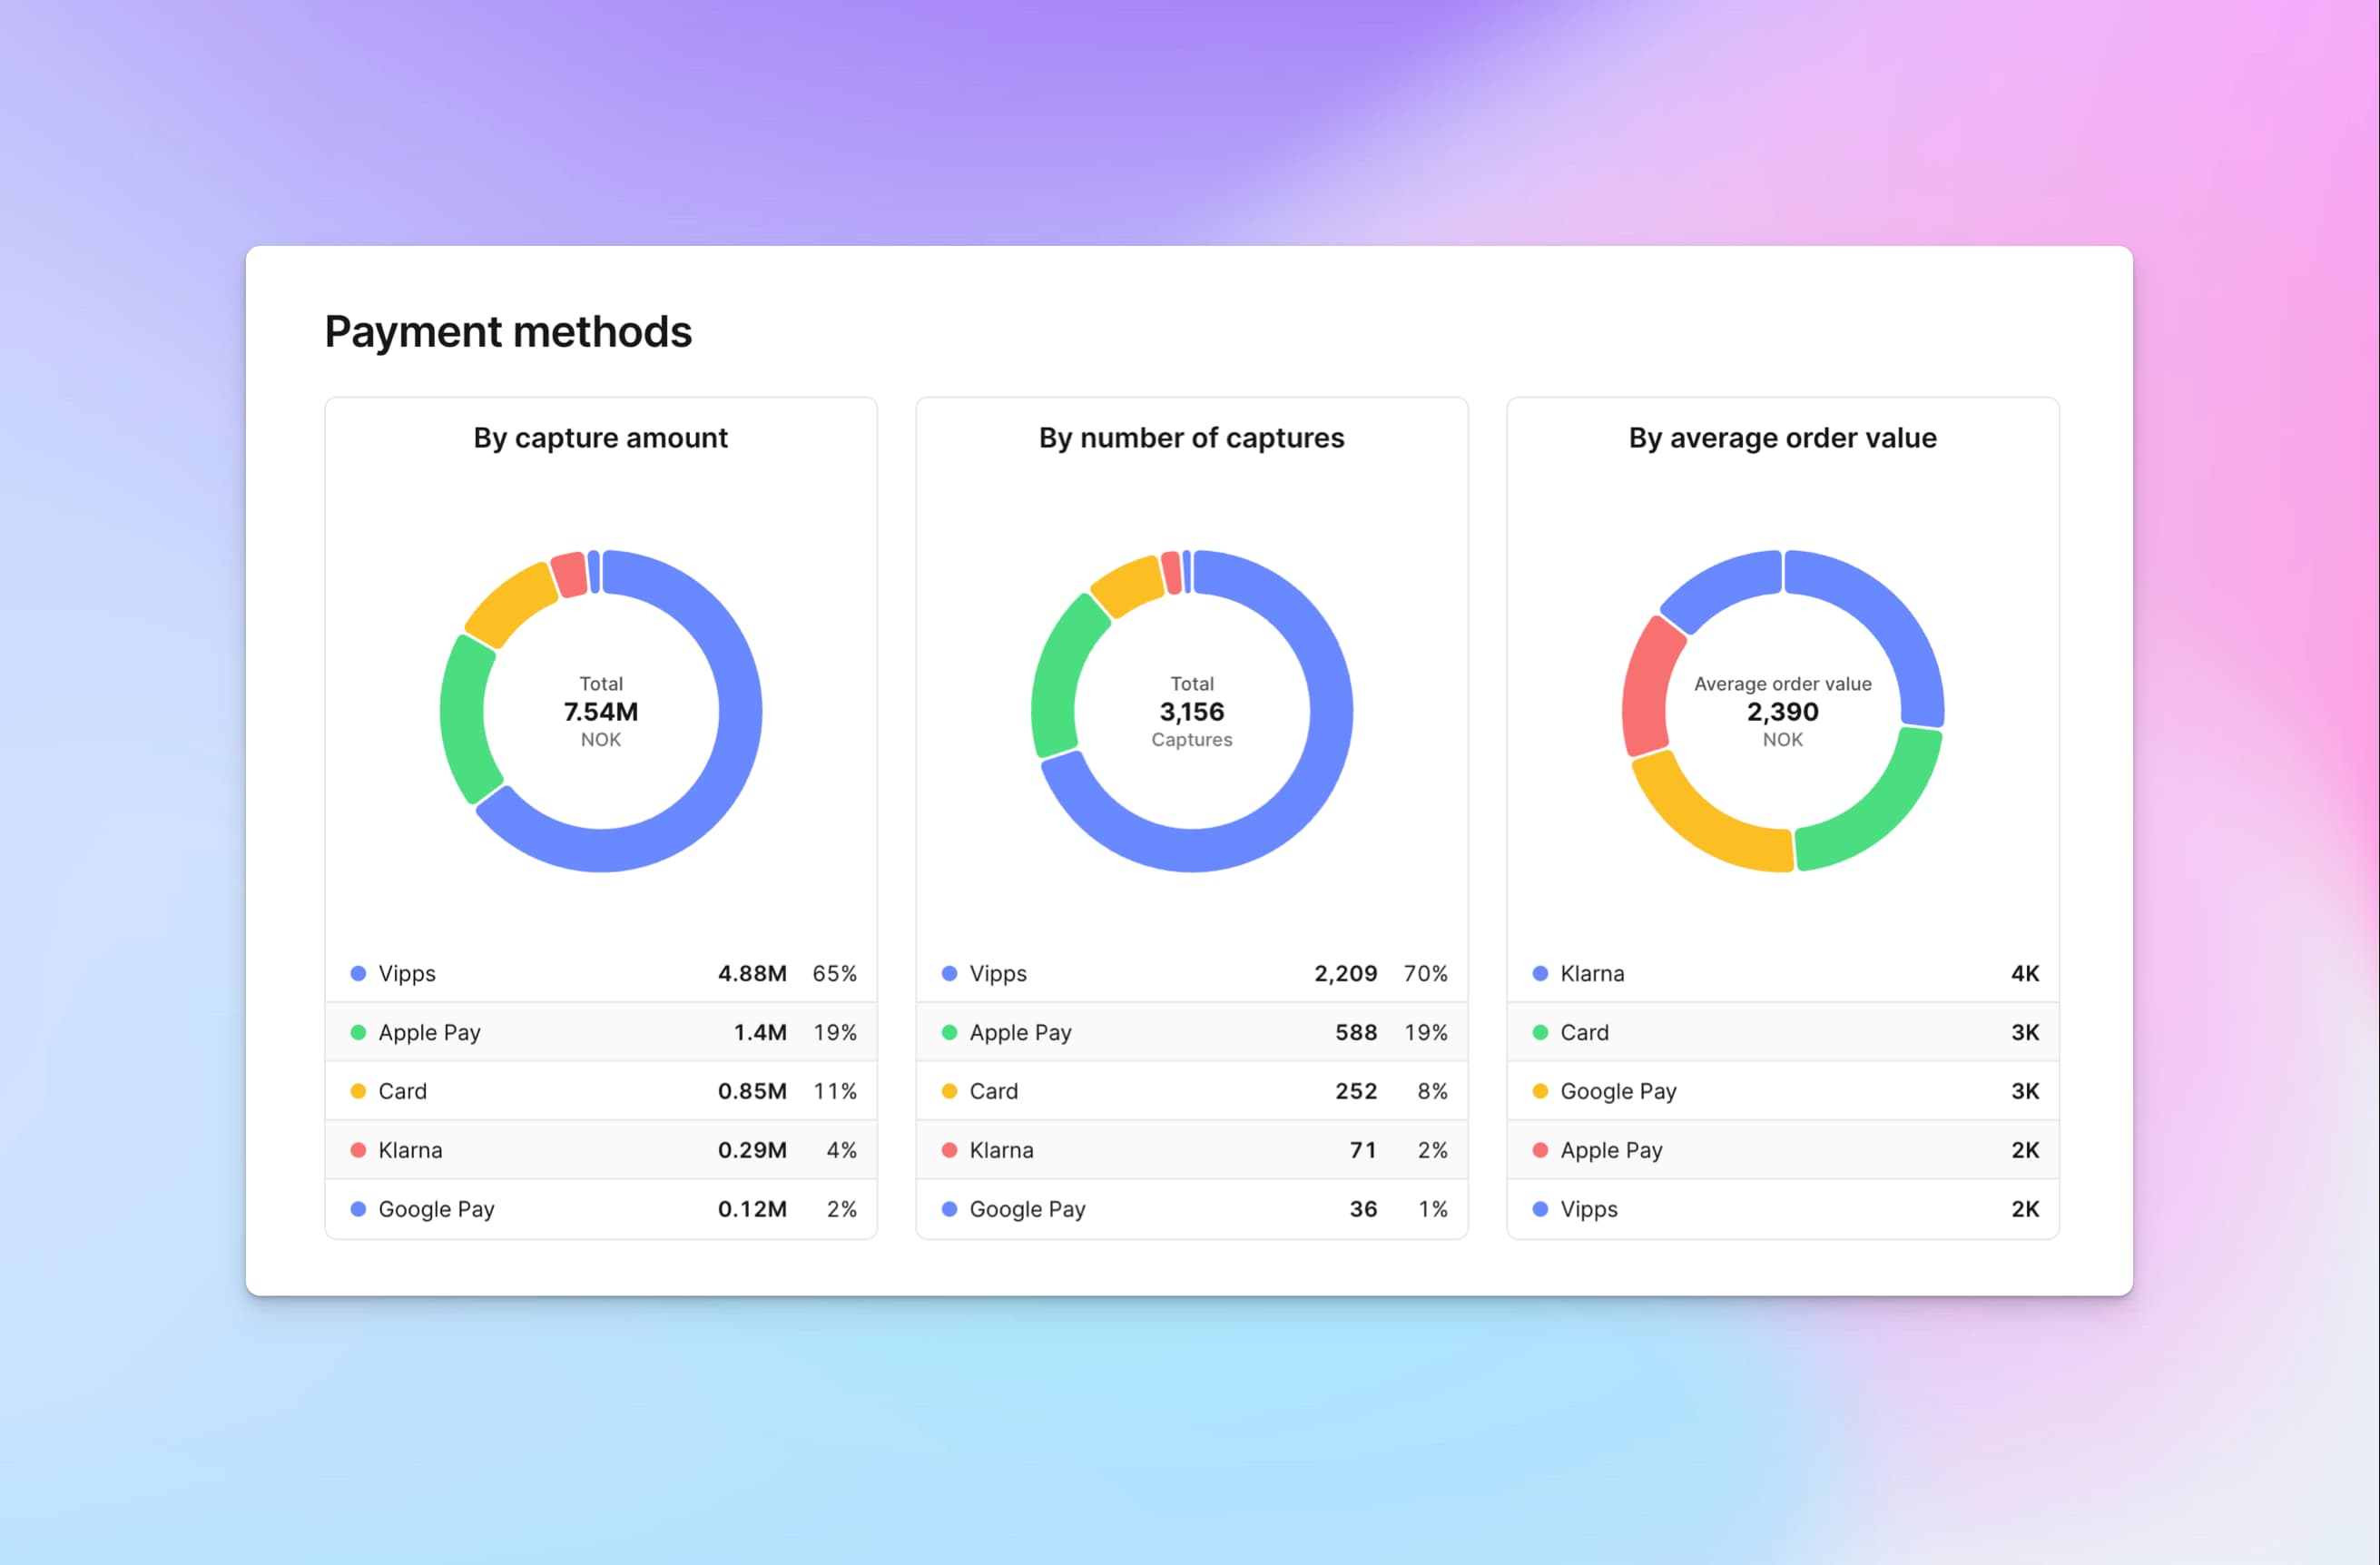
Deep Dive into Payment Methods
The heart of the new dashboard is the detailed insight into how different payment methods are performing. This is essential for understanding customer preferences and optimizing your checkout strategy.
The dashboard now presents data divided into three key areas using clear, informative pie charts:
- By Capture Amount: See what percentage of your total sales volume comes from methods like Vipps (which, in the example, accounts for 65% of volume), Apple Pay, Klarna, and Card payments.
- By Number of Captures: Understand which methods customers use most frequently. Some methods might generate high volume with few transactions (high AOV), while others handle many transactions with a lower average value.
- By Average Order Value (AOV): Discover which payment method attracts customers with the largest basket size. This data is invaluable for marketing and strategic decision-making!
Full Transaction Control and Reconciliation
In addition to the visual insights, a detailed table provides you with a comprehensive overview, including:
- Captured amount
- Refunded amount
This level of detail makes it significantly easier to match sales data against your accounting records, giving you confidence and full control over all transactions and refunds.
Easier, Faster, and Smarter Filtering
The dashboard was built with user-friendliness in mind. You can now easily:
- Filter data by your preferred time period (e.g., Last 7 Days or Last 30 Days).
- Switch between different companies you manage (if applicable).
- Access all reports and tools directly from the streamlined side menu.
This new analytics dashboard is a vital tool for all Dintero merchants aiming to make data-driven decisions and maximize profitability.
Log into Dintero Backoffice today to explore the new Dashboard and take full control of your sales data!